Extract Measurements
The extraction tool is used to measure image counts within user-defined regions of interest (ROIs).
Unlike the image inspection and metadata inspection tools, extraction produces quantitative outputs that can be saved and analyzed later.
The extraction process can be launched either directly from the command line or through the graphical interface.
Interactive vs Non-Interactive Extraction
Extraction can operate in two different modes.
Non-Interactive Mode
When all required extraction parameters are supplied through the command line or GUI form, the extraction begins immediately.
This mode is ideal for automated processing and batch workflows involving large numbers of files, or simply when the user already knows the desired extraction parameters and does not need to interactively define them.
Interactive Mode
When extraction parameters are not provided, the interactive extraction interface is launched.
The interactive interface allows users to visually inspect images and define the extraction region before measurements are performed.
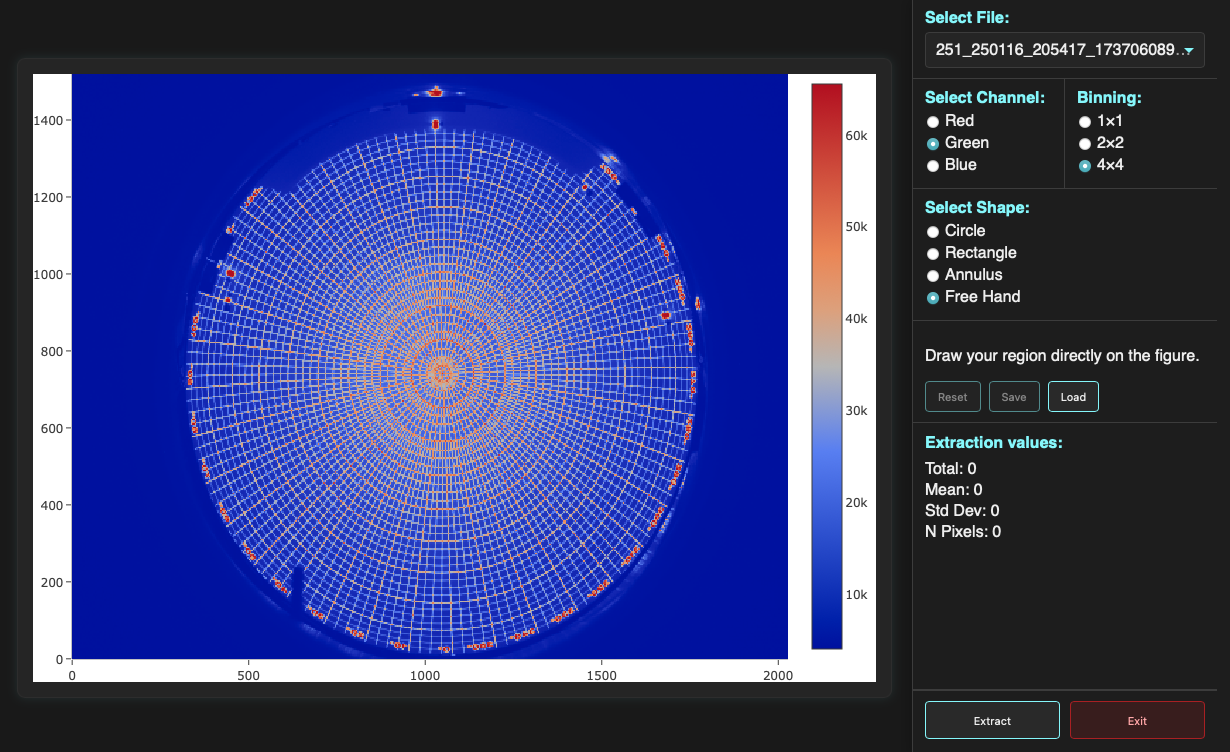
Interactive extraction interface.
Overview
The extraction tool supports processing multiple files simultaneously.
Although extraction will be applied to every selected file, only a single file is displayed at a time during interactive inspection.
When the interface opens:
Files are sorted alphabetically.
Only the first file is initially loaded.
Additional files may be inspected using the file selector in the upper right corner.
The same extraction parameters are applied to every file during the final extraction step.
This design minimizes loading time while still allowing representative images to be inspected before launching a potentially long extraction process.
Note
Extracting measurements from large datasets may require several minutes depending on image size, extraction geometry, and number of files.
Image Display
The extraction interface includes a lightweight image viewer optimized for responsiveness.
Compared to the dedicated image inspection tool (see image inspection tool guide), fewer visualization options are available.
Channel Selection
Only one channel may be displayed at a time.
The displayed channel can be selected using the radio buttons located above the image viewer.
Image Binning
To improve responsiveness, images are initially displayed using 4×4 binning.
Users may optionally switch to:
4×4 binning (default)
2×2 binning
Full-resolution 1×1 display
Lower binning provides a more responsive experience, while full-resolution display allows more precise placement of extraction regions.
Extraction Geometries
Four extraction modes are available:
Circle
Rectangle
Annulus
Free Hand
Circle
The circular extraction region is the default mode when the interface opens.
Required parameters:
Center (x, y pixels)
Radius (pixels)
Rectangle
The rectangular extraction region requires:
Center (x, y pixels)
Width (pixels)
Height (pixels)
Annulus
The annulus (ring) extraction region requires:
Center (x, y pixels)
Inner radius (pixels)
Outer radius (pixels)
Angular Limits
Circular, rectangular, and annular extraction regions also support angular limits.
The default angular range is:
-180° to +180°
which corresponds to the complete geometry.
By adjusting the angular limits, users may extract only a sector of the selected region.
Examples include:
Circular wedges
Partial annuli
Sector-shaped regions
Note
Not all geometry fields are present in every extraction record. The set of
geometry parameters depends on the selected extraction shape. For example,
circular extractions include radius, while annular extractions include
inner_radius and outer_radius.
Interactive Region Preview
As soon as a valid set of parameters is entered, the extraction geometry is drawn on top of the image.
The overlay updates automatically whenever parameters are modified.
This provides immediate visual feedback and allows users to precisely verify the extraction region before measurements are performed.
Quick Measurement Preview
Whenever a valid extraction region is present, a quick measurement preview is displayed.
The preview reports the counts measured within the selected region for the currently displayed file and channel.
This allows users to rapidly evaluate candidate extraction regions before launching the full extraction.
Free-Hand Extraction
Free-hand extraction provides a flexible alternative to the predefined geometries.
In free-hand mode:
Zoom-drag behavior is disabled.
Mouse dragging is used to draw extraction regions.
Shapes automatically close when drawing is completed.
Measurement previews are generated after the shape is completed.
Editing Free-Hand Shapes
Free-hand shapes remain editable while free-hand mode is active.
Users may:
Select existing shapes.
Move shapes.
Modify vertices.
Add additional vertices.
Resize regions by dragging control points.
Multiple Regions
Unlike the predefined extraction geometries, free-hand mode supports multiple simultaneous extraction regions.
This makes it possible to measure complex structures that cannot easily be described by a single circle, rectangle, or annulus.
Saving and Loading Shapes
Free-hand regions can be saved and loaded.
Saved regions may be reused across multiple extraction sessions, ensuring consistent measurements between datasets.
Deleting Shapes
To delete a free-hand region:
Select the desired shape.
Press the Delete key.
Persistent Shapes
Warning
Free-hand regions are interactive only while free-hand mode is active. Switching to another extraction mode disables editing of existing free-hand regions, not even by switching back to free-hand mode.
In addition, free-hand shapes remain visible after switching to another extraction mode, and they will not be deletable either.
Launching the Extraction
Once a satisfactory extraction region has been defined, users may click Extract.
The extraction process then runs in the background and is applied to all selected files.
Clicking Exit closes the interface without performing any extraction.
Output Formats
Extracted measurements can be written in two formats:
JSON (default)
CSV
Understanding the Output
Extraction results are written as one record per input file.
In JSON output, the file contains a list of dictionaries. Each dictionary corresponds to one extracted image.
In CSV output, the same information is flattened into a table, with one row per file and one column per field.
File and Camera Fields
filenamePath or basename of the extracted image file.
cameraCamera identifier, usually extracted from the filename or metadata.
unix_timeUnix timestamp of the exposure, in seconds since 1970-01-01 UTC.
Extraction Geometry Fields
shapeExtraction region type. Common values include
circle,rectangle,annulus, andfreehand.x0,y0Center coordinates of the extraction region, in pixels.
radiusRadius of a circular extraction region, in pixels.
side1,side2Side lengths of a rectangular extraction region, in pixels.
inner_radius,outer_radiusInner and outer radii of an annular extraction region, in pixels.
start_angle,end_angleAngular limits of the extraction region, in degrees.
A range from
-180to180corresponds to the complete shape. Smaller ranges define a sector of the selected geometry.
Note
Not all geometry fields are present in every extraction record. The set of
geometry parameters depends on the selected extraction shape. For example,
circular extractions include radius, while annular extractions include
inner_radius and outer_radius.
Weather and Environmental Fields
temperatureAmbient temperature.
dew_pointDew point temperature.
wind_speedWind speed.
pressureAtmospheric pressure.
humidityRelative humidity.
condition_codeEncoded weather condition indicator.
Astronomical and Timing Fields
sunaltazSolar altitude at the time of the exposure, in degrees.
moonaltazLunar altitude at the time of the exposure, in degrees.
moon_illuminationIlluminated fraction of the Moon, from
0to1.nightObserving-night identifier in
YYYYMMDDformat.date_utcExposure timestamp in UTC.
date_localExposure timestamp in local time.
mjdModified Julian Date of the exposure.
hours_utcUTC time as
HH:MM:SS.hours_localLocal time as
HH:MM:SS.float_hours_utcUTC time expressed as a fractional day.
float_hours_localLocal time expressed as a fractional day.
Channel Measurement Fields
Each color channel is stored as a nested dictionary in JSON output.
The standard channels are:
redgreenblue
Each channel contains the same measurement fields.
total_countsSum of all pixel values inside the extraction region.
mean_countsMean pixel value inside the extraction region.
stdStandard deviation of pixel values inside the extraction region.
npixelsNumber of pixels included in the extraction region.
CSV Field Names
In CSV output, nested channel measurements are flattened by prefixing each field with the channel name.
For example:
red_total_countsred_mean_countsred_stdred_npixelsgreen_total_countsgreen_mean_countsgreen_stdgreen_npixelsblue_total_countsblue_mean_countsblue_stdblue_npixels
The CSV file therefore contains one row per image and one column per extracted quantity.
Additional Information
The exact set of fields written by an extraction depends on the selected extractor and the metadata available for the input files.
See extractor architecture developer notes for detailed descriptions of individual extractors, their parameters, and any extractor-specific output fields.
The same extraction results returned by the command-line interface are also available through the Python API. See extraction API reference for examples of running extractors and processing the returned dictionaries directly.